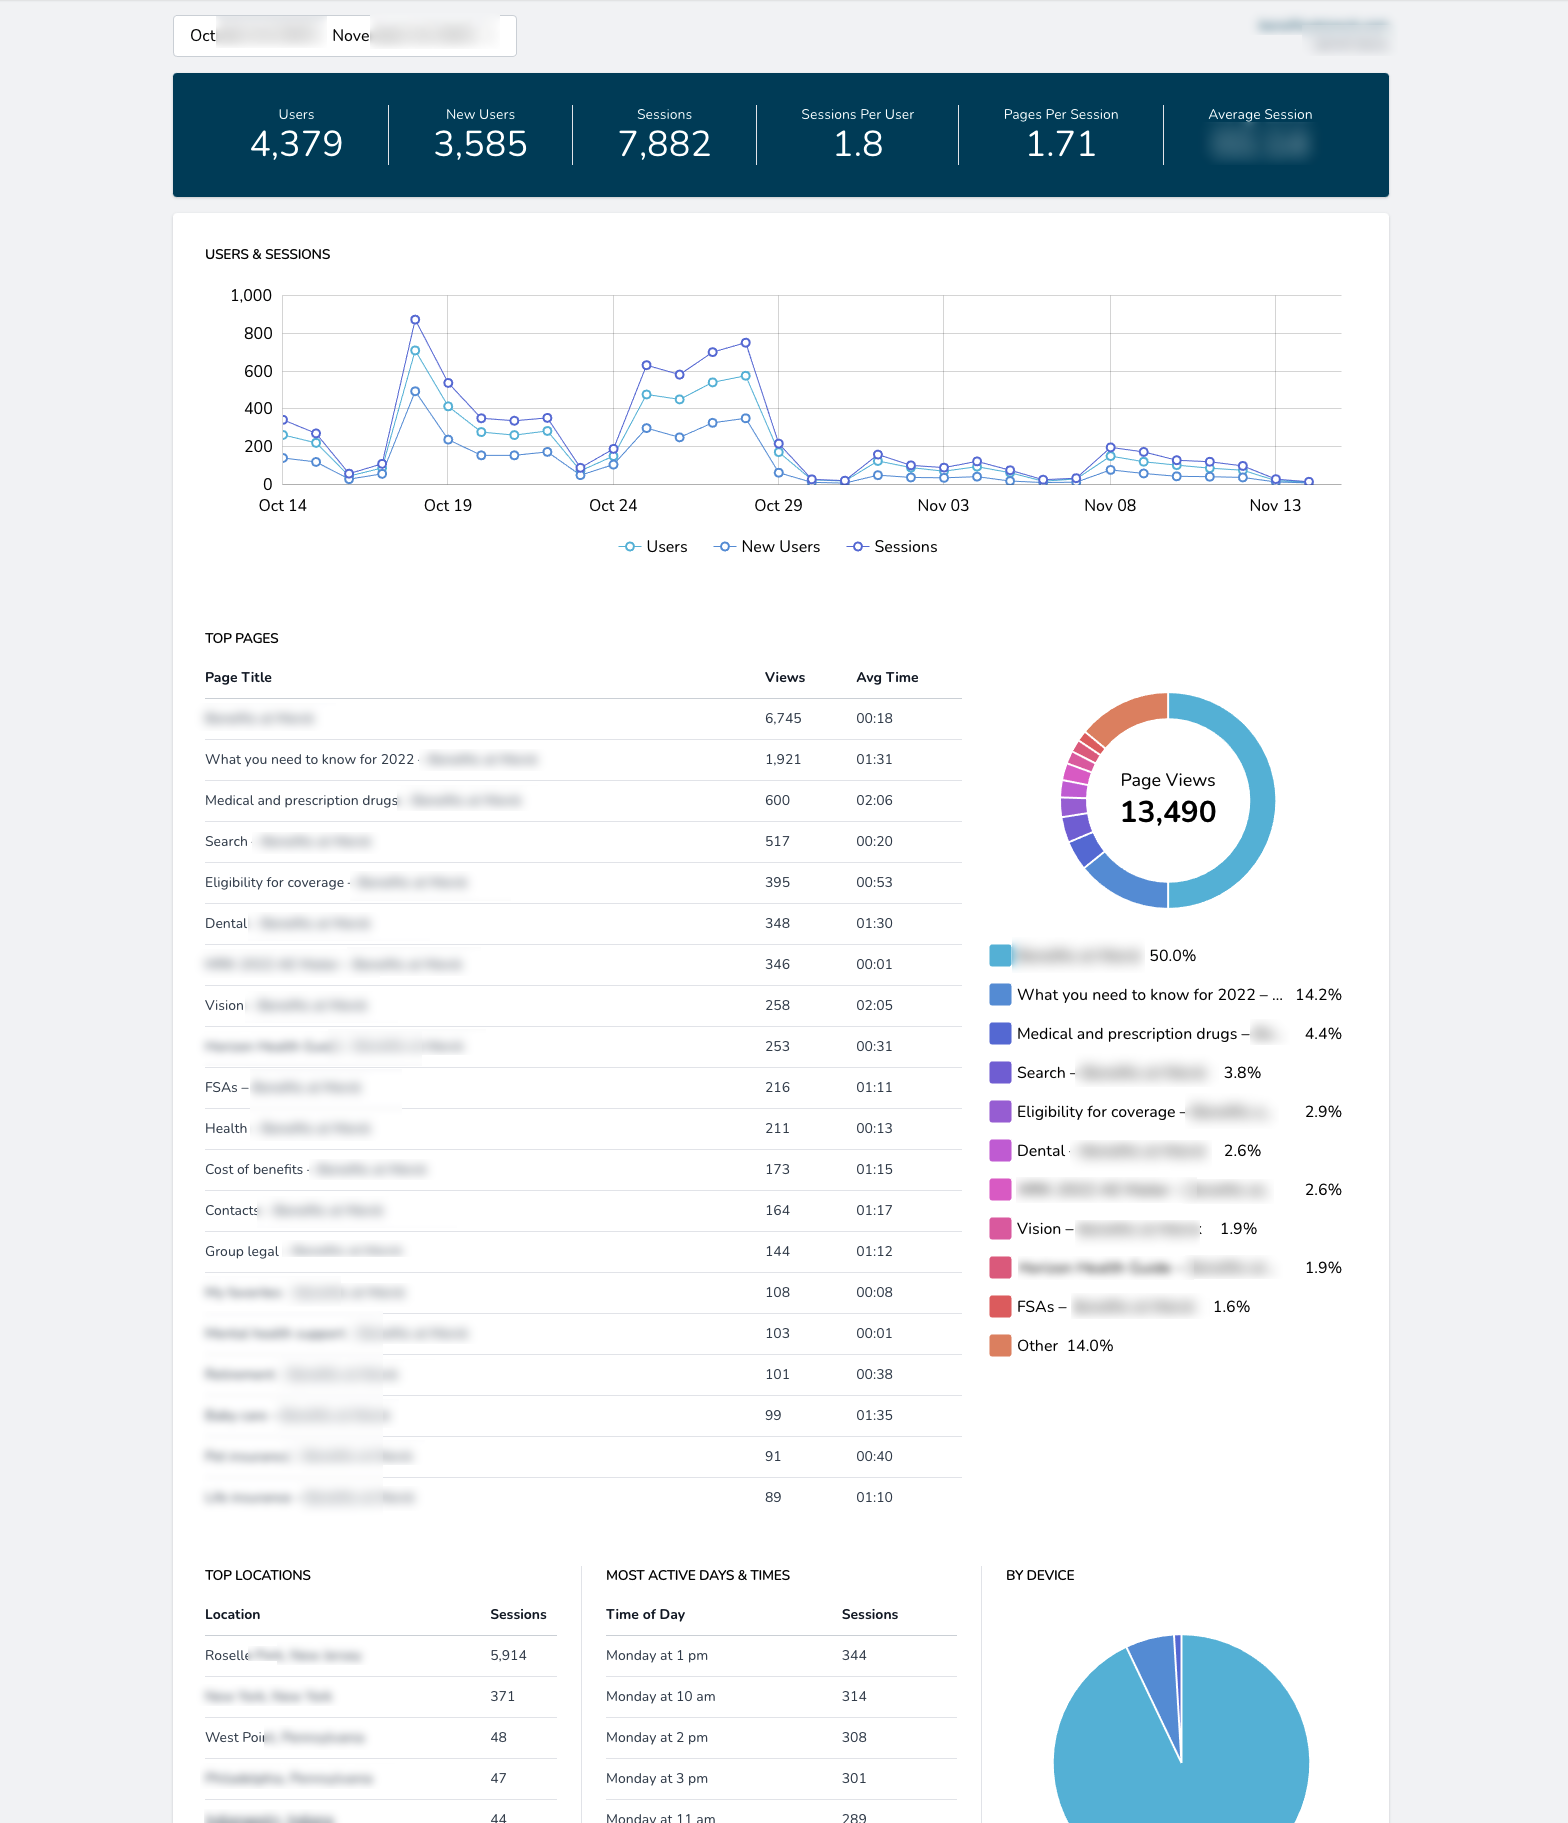
Maintaining a successful benefits microsite is much easier with an analytics dashboard that curates the relevant data from the mountain of information collected by Google.
Analytics Wrangling is Getting Harder
We all know how important web analytics are to the continued success of your client’s benefits microsite. Especially now that we’ve seen them being used as a year-round resource, not just during open enrollment. But collecting and interpreting Google traffic data is becoming an increasingly complex task. Even more so with the much-maligned Google Analytics 4 (GA4) update released in 2020. Even seasoned search marketing experts have complained that GA4 is now even more difficult to use, with important data being harder to access.
Our benefits communications partners have simpler demands from their clients’ web analytics. There’s no need to collect data on each individual user like their demographics or conversions. Just general usage trends like which pages get the most traffic, and most popular search terms.
So, We Built a Custom Analytics Dashboard


What our Analytics Dashboard Taught Us:
New Look Means New Information
If a microsite’s homepage has the same look, people spend less time on the site as they assume nothing has changed. So we suggest updating the look of the site periodically, especially when plans change significantly, to visually tell the user that things are different this year.
People Don’t Speak Jargon
The search terms visitors use most often don’t line up with industry jargon. As HealthEquity reports in its white paper Five Strategies To Help Your People Save More And Take Control Of Their Benefits, “Not everyone is familiar with terms like “high-deductible health plan,” “copay,” “matching” or “vesting,” and many consider their benefits options to be complex.” Knowing what words visitors are using helps us optimize the microsite’s content to return the most relevant search results.
A Quick Visit Can Be a Good Thing
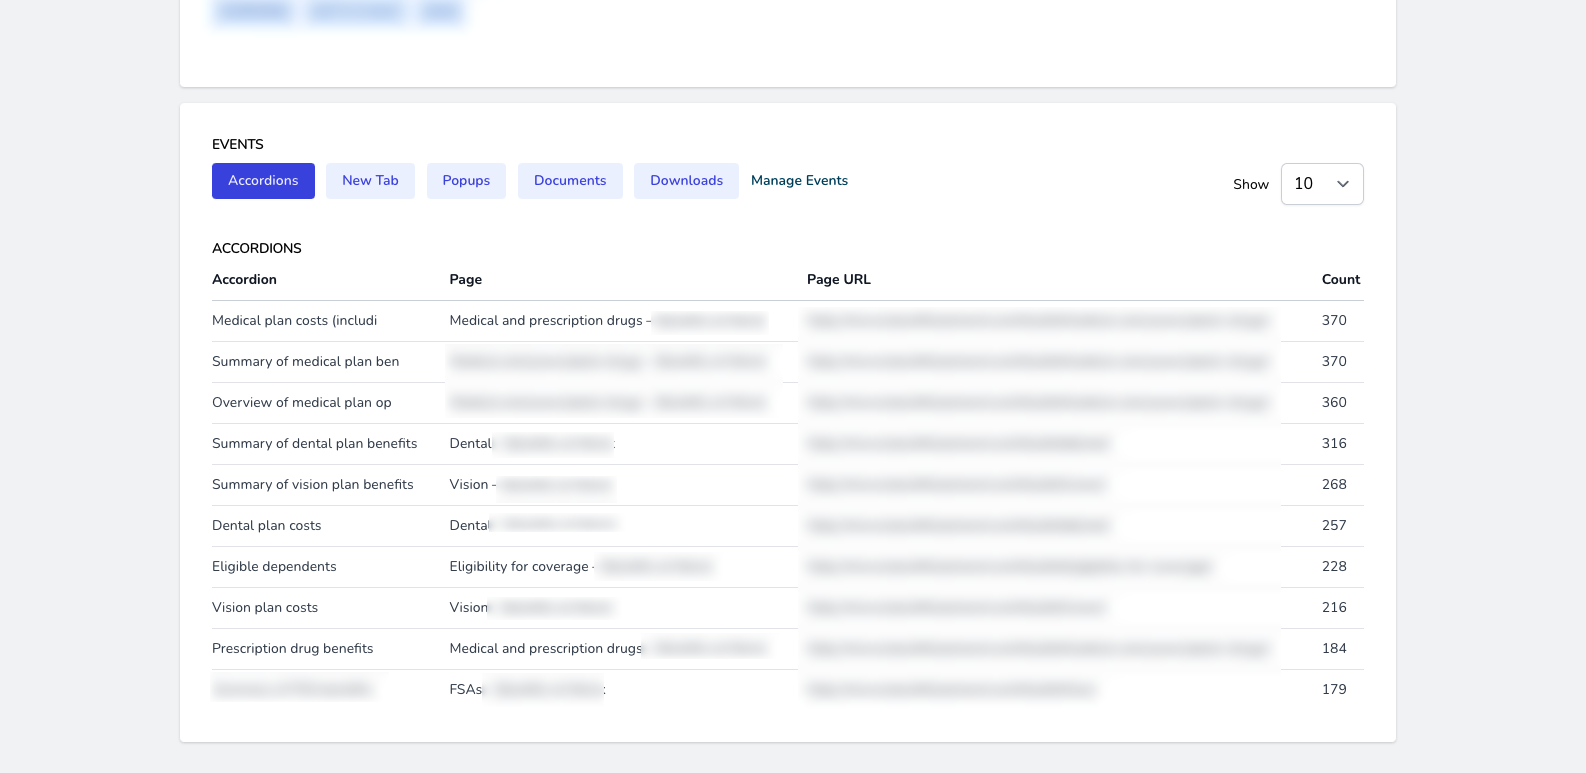
For typical corporate sites, the goal is to keep visitors on the site for as long as possible. But having a low session time on a benefits microsite isn’t necessarily a bad thing. Enrollment sites link out to documents and other supporting sites. An employee’s session may be only a few minutes but, if they got to the information they needed quickly or left the site to visit a supporting site to learn more about a program, those are all successes. Tracking these external links helps support this interpretation and shows what documents or services are getting the most attention from users.
What’s Next?
As employers are investing more in videos for their benefits communications, it’s more important to track how well they’re working. As Rob Grubka, CEO of Health Solutions at Voya Financial said, “… almost two-thirds of employees say educational videos are important resources in making benefits decisions.”
The challenge right now is that the most popular video hosting platform, YouTube, has the most robust analytics accessible, but isn’t allowed past most corporate firewalls. Plus, other hosting platforms force you to compile usage data manually.
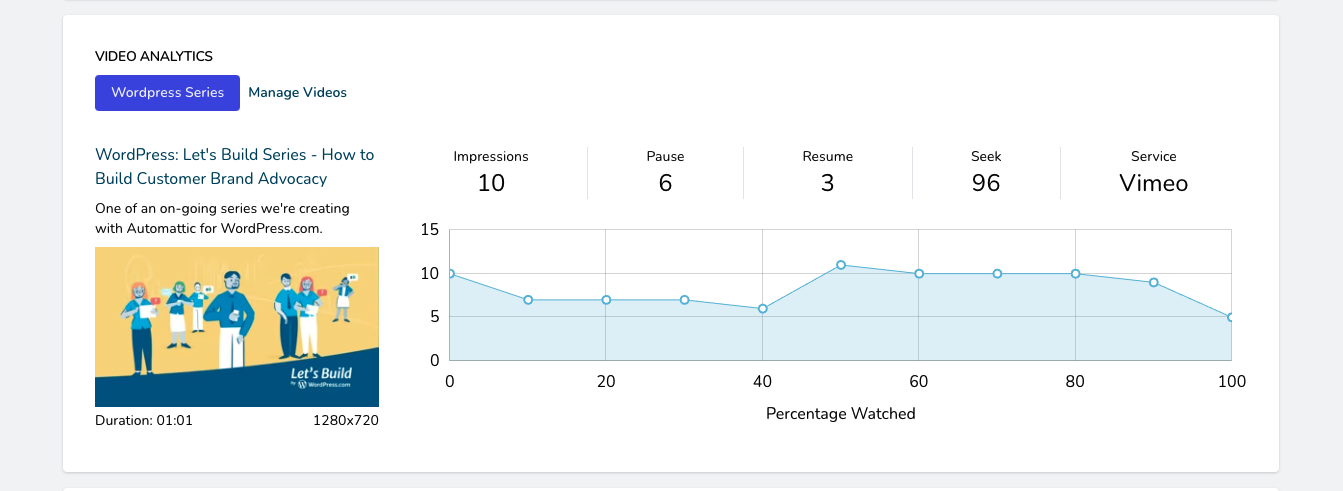
So we’re currently working on adding video analytics to the dashboard. This will work by passing data through Google Analytics and then building reports based on that data to put on the dashboard. From this, we can see how often they’re watched, and for how long. Then make better decisions about where to invest in more video content.


